
Most fleet managers know where their vehicles are. Far fewer know how they’re being driven. Yet for many businesses, the way vehicles are driven has a bigger effect on safety, fuel, maintenance and reputation than almost anything else the fleet does.
Driver behaviour monitoring turns that unknown into clear, fair data. It’s now a standard part of a modern GPS tracking system, and with Signals it’s included from our $18 plan. This article explains what driver behaviour monitoring measures, why it matters, the benefits for your fleet and the risks it helps you avoid.
What is driver behaviour monitoring?
A GPS tracker fitted to each vehicle records not just where the vehicle goes, but how it moves. Signals’ GPS fleet tracking measures:
- Speed, including when and where a vehicle exceeds the limit.
- Harsh braking — sudden, heavy stops that often mean following too closely or reacting late.
- Harsh acceleration — aggressive take-offs that waste fuel and wear the vehicle.
- Harsh cornering — taking corners too fast, which risks rollovers, lost loads and loss of control.
These events are scored for each driver, so you can see who is driving well, who needs support, and how the fleet is trending over time. Reports also cover idling, utilisation and time on the road.
What it looks like in practice
Here’s a real example: one of Signals’ own service utes, tracked over three working days in Christchurch in early November 2026. We’ve used our own vehicle on purpose. The point isn’t a perfect score. It’s being able to see what’s actually happening.
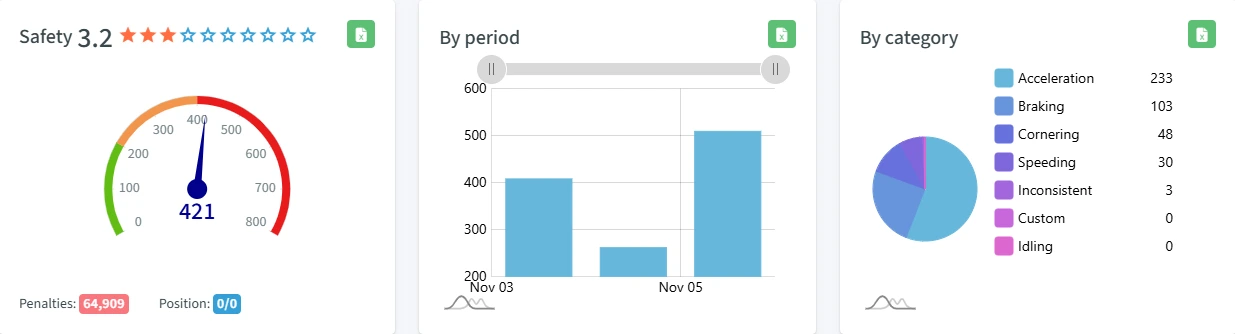
The safety panel rates this driver 3.2 out of 10 stars. Over the three days the tracker logged 417 events: 233 harsh accelerations, 103 harsh braking events, 48 harsh corners, 30 speeding events and three flagged as inconsistent driving.
The breakdown is where the value is. More than half of the events (56%) are harsh acceleration, a habit that costs fuel and tyres but is one of the easiest to coach. Often just showing a driver the number is enough. The by-period chart shows how the score moves day to day, so you can tell a one-off bad day from a pattern.
A score like this isn’t a verdict on the driver. Stop-start urban trade work, short hops between sites and a loaded vehicle all push event counts up. That’s why a baseline matters, and why the conversation matters more than the number.
Every dashboard panel exports to Excel in one click, ready for a health and safety report or a toolbox meeting. Behind the dashboard, Waka Data has dedicated views for safety, violations, collisions, events, driving points, fuel and CO₂, and engine hours, so you can move from the overview to the detail when something needs a closer look.
Why driver behaviour matters for fleets
The road is a workplace
For many businesses, driving is the most dangerous thing their people do each day. A University of Otago study of work-related road deaths in New Zealand between 1999 and 2014 found an average of 116 deaths a year involving someone driving for work, or someone killed because of another person’s work driving. Workers and bystanders made up around 23% of the national road toll, and the researchers noted their figures are likely an under-estimate.
Under the Health and Safety at Work Act 2015, a work vehicle is a workplace. Businesses must manage the risks to their drivers, and to other road users affected by their work, so far as is reasonably practicable. You can’t manage a risk you can’t see. Driver behaviour data shows you where the risks are.
Every vehicle carries your brand
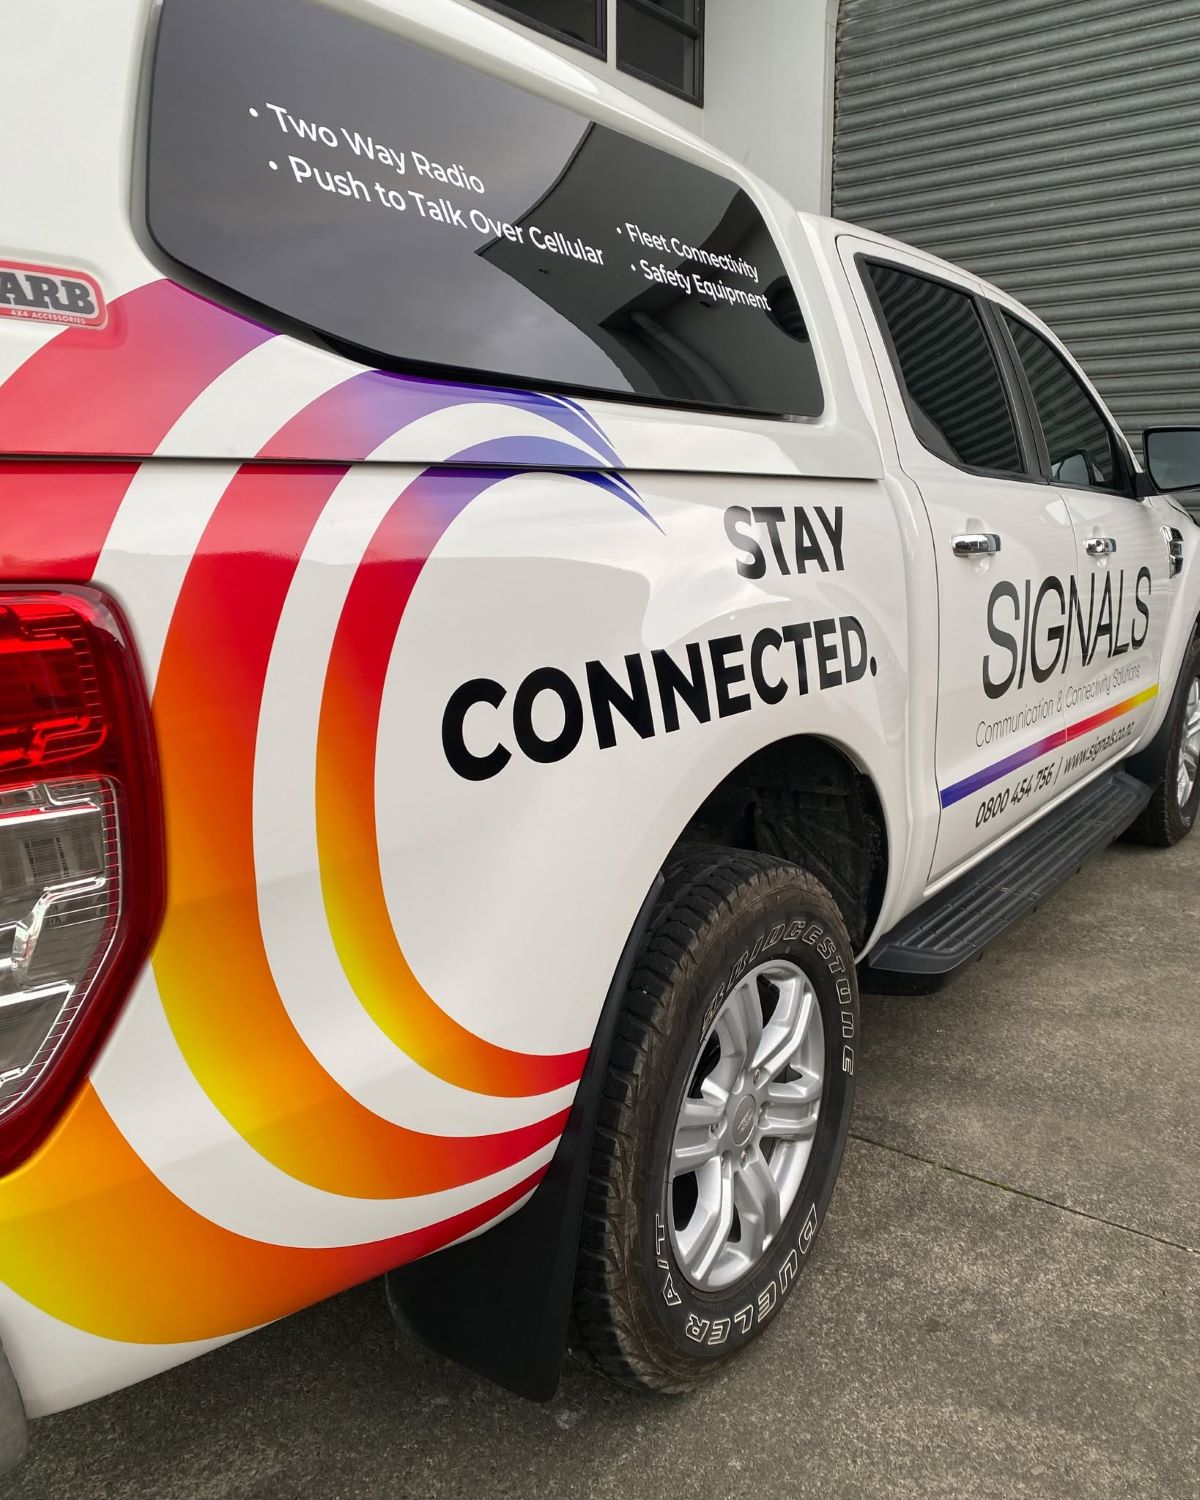
A signwritten ute speeding through a school zone, or a van tailgating on the motorway, is a public advertisement for your business, for the wrong reasons. Driver behaviour monitoring helps you protect your reputation, and gives you facts when a member of the public calls to complain.
Driving style drives costs
Harsh acceleration, high speeds and long idling burn more fuel. Harsh braking and cornering wear out brakes, tyres and suspension faster. Crashes bring repair bills, insurance excesses, higher premiums and vehicles off the road. Small changes in how each driver drives add up quickly across a fleet.
Idling is a good example of a cost you can’t see without data. On the same ute, the engine ran for 26.6 hours over the period and 3.71 of those hours, or 13.9%, were spent idling. Almost all of it happened on one day, which points to a particular job or site rather than an everyday habit.
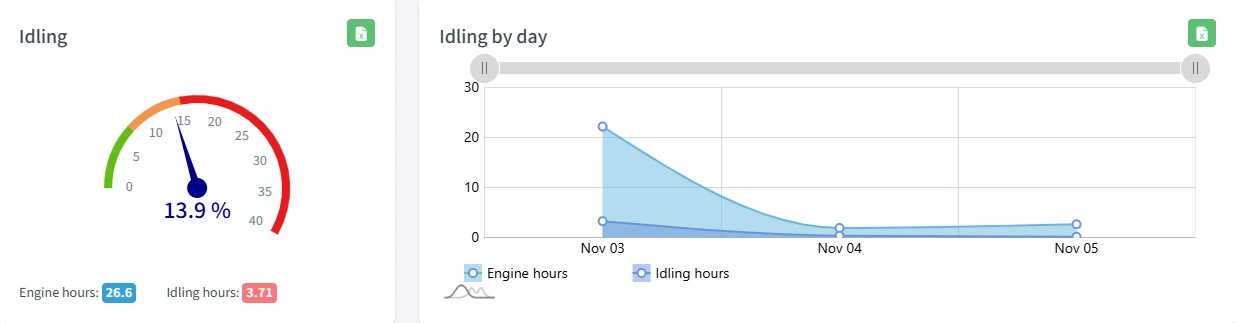
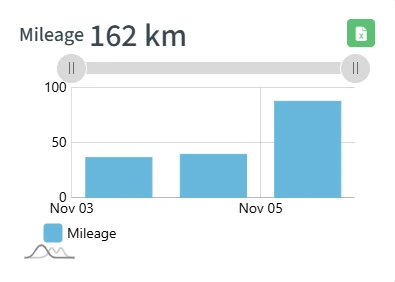
Nearly four hours of idling against 162 km driven is easy to spot once it’s on screen, and usually easy to fix: engine off while waiting on site. It matters beyond fuel, too. Idle time adds engine hours without moving the vehicle, and engine hours are what maintenance is scheduled against in level four, so unnecessary idling brings services forward.
The benefits for your fleet
| Benefit | How driver behaviour monitoring helps |
|---|---|
| Safer drivers | Identifies risky habits early, so you can coach drivers before an incident rather than after one |
| Lower fuel costs | Less speeding, harsh acceleration and idling means less fuel used across the fleet |
| Lower maintenance costs | Smoother driving reduces wear on brakes, tyres, suspension and drivetrain |
| Fewer crashes and claims | Safer driving means fewer incidents, lower repair costs and a better position with your insurer |
| Fair, factual conversations | Data replaces guesswork and hearsay — “the data behind a conversation, not a guess” |
| Protection for good drivers | Evidence to answer complaints, disputes and false claims about how a vehicle was driven |
| Recognition and motivation | Driver scores let you recognise and reward your safest drivers |
| Better H&S reporting | Measurable data for your health and safety system, board reporting and client requirements |
The risks driver behaviour monitoring helps you avoid
| Behaviour | What it can lead to | What monitoring gives you |
|---|---|---|
| Speeding | Crashes, more serious injuries, speeding fines, demerit points and lost licences | Speed events by driver, location and time, so patterns can be addressed |
| Harsh braking | Rear-end crashes, often linked to following too closely or distraction | A clear signal of drivers who may be tailgating or not looking far enough ahead |
| Harsh cornering | Rollovers, loss of control, shifted or lost loads and damaged goods | Identification of drivers and routes where cornering speeds are too high |
| Harsh acceleration | Higher fuel use, extra wear and a higher-risk driving style | Evidence for coaching smoother driving |
| Excessive idling | Wasted fuel, extra engine hours and unnecessary emissions | Idling reports by vehicle |
| Unverified complaints | Damaged reputation and unfair outcomes for drivers | Trip and event data to confirm or disprove what happened |
Making driver behaviour monitoring work
The technology is only half of it. The fleets that get the most from driver behaviour data use it to support drivers, not to catch them out.
- Tell drivers first. Explain what is being measured, why, and how the information will be used. Being open about monitoring is good practice under the Privacy Act 2020 and builds trust.
- Start with a baseline. Run the system for a few weeks before acting, so you understand what normal looks like across your fleet.
- Coach, don’t punish. Use the data to start conversations, find the cause and agree improvements. Many harsh events have a reason: a route, a deadline or a vehicle issue.
- Recognise good driving. Share the most improved and safest drivers. Positive recognition often changes behaviour faster than warnings.
- Give drivers their own view. With driver logins, drivers can see their own scores, trips and week, and improve on their own. Driver logins can be added for $2/month.
- Review regularly. Build driver behaviour into weekly or monthly reporting and your health and safety meetings.
- Write it into policy. Include driving standards, monitoring and follow-up in your vehicle and health and safety policies.
Driver behaviour from $18 a month
Signals’ GPS fleet tracking is priced per vehicle, per month, so you can choose the level that suits your fleet:
| Level | Price (per vehicle, per month) | What it covers |
|---|---|---|
| Level one — Where they are | $15 + GST | Live GPS tracking and history, geofences, arrivals and departures, mobile apps |
| Level two — How they are driven | $18 + GST | Everything in level one, plus driver behaviour and scoring |
| Level three — The whole picture | $35 + GST | Adds dashboards and reporting |
| Level four — With fleet maintenance | $37 + GST | Adds fleet maintenance scheduling against distance and hours |
| Driver logins (add-on) | $2 + GST | Drivers see their own scores, trips and week |
For $3 a month more than basic tracking, the $18 plan adds the data that most directly affects safety, fuel and maintenance. Hardware and installation are quoted separately.
Why fleets choose Signals for GPS tracking
- We install it ourselves. Signals technicians fit your trackers rather than sending you to find an installer, and we stay involved for the life of the system.
- One visit, not several. We can fit GPS at the same time as radios, vehicle Wi-Fi and safety equipment, so vehicles come off the road once.
- Set up before it ships. Your account, vehicles and reporting are configured ready to use.
- Road user charges sorted too. As a solution partner for RUC Monkey, we can also manage your electronic RUC.
- Our own team in Christchurch and Auckland, supporting fleets nationwide.
Talk to us about driver behaviour monitoring for your fleet. Call 0800 454 756 or email sales@signals.co.nz for a quote.
Related: Health and safety for towing and recovery fleets · Seven reasons vehicle Wi-Fi is essential for fleets · Lone worker safety in New Zealand
Common questions
What does driver behaviour monitoring measure?
Signals’ GPS tracking measures speed, harsh braking, harsh acceleration and harsh cornering, and scores each driver. Reports also show idling, distance, utilisation and time on site.
Which Signals plan includes driver behaviour?
Driver behaviour and scoring are included from level two, “How they are driven”, at $18 plus GST per vehicle per month.
Can drivers see their own scores?
Yes. With the driver logins add-on, at $2 plus GST per vehicle per month, drivers can see their own scores, trips and week.
Is it legal to monitor how employees drive?
Yes, for legitimate business purposes such as health and safety and vehicle management. Be open with drivers about what is collected and why, and handle the information in line with the Privacy Act 2020 and your employment agreements.
Will driver behaviour monitoring reduce my costs?
For most fleets, yes. Smoother, slower driving and less idling reduce fuel use and wear, and fewer incidents reduce repair and insurance costs. The size of the saving depends on your fleet and how actively you use the data.
This article is general information and isn’t legal advice. Responsibility for health and safety and privacy compliance rests with each business.
Sources
- Signals NZ — GPS and fleet tracking (plans and features): signals.net.nz/gps-and-fleet-tracking/
- University of Otago, Injury Prevention Research Unit — Fact Sheet 44: Work-related road traffic fatalities 1999–2014 (May 2019): psm-dm.otago.ac.nz